Download predictions
You can download the validation and, if provided, the test dataframe predictions from a completed experiment (1). Also, it is possible to predict new data using a trained model and obtain its validation and test dataframe predictions (2).
1: View experiments: To download the validation/test predictions generated after a model (experiment) is completed:
-
In the H2O Hydrogen Torch navigation menu, click View experiments.
-
In the View experiments card, select the experiment (name) you want to download its generated predictions.
-
Click Download predictions.
2: View predictions: To score on new data and download the predictions using a completed experiment:
-
In the H2O Hydrogen Torch navigation menu, click View predictions.
-
In the View predictions table, select the name of the predictions you want to download.
Note
-
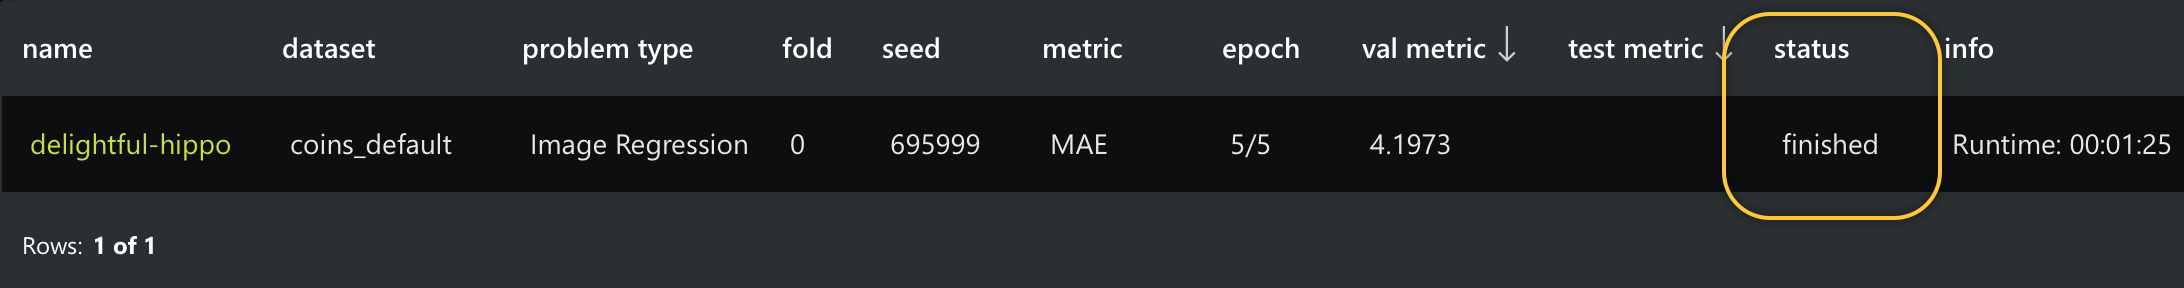
Before selecting the predictions you want to download, make sure the status is finished. Predictions become downloadable only when the status is finished:
-
-
Click Download predictions.
Note
To score on new data using a completed experiment, see H2O Hydrogen Torch UI. All generated predictions using a completed experiment are stored on the View predictions card.
Prediction files formats
Downloaded predictions have the following format:
-
Predictions downloaded from a completed experiment on the View experiments card are in a
.zipfile containing the following files:-
validation_predictions.csv- The
.csvfile is a structured dataframe with final predictions for the provided validation dataframe.
- The
-
validation_raw_predictions.pkl- The
.pklfile is a pickled Python dictionary with raw predictions for the provided validation dataframe.
- The
If the experiment contained a test dataframe, H2O Hydrogen Torch also includes the following two files in the
.zipfile:-
test_predictions.csv- The
.csvfile is a structured dataframe with final predictions for the provided test dataframe.
- The
-
test_raw_predictions.pkl- The
.pklfile is a pickled Python dictionary with raw predictions for the provided test dataframe.
- The
-
-
Predictions scored on new data are in a
.zipfile containing the following files:-
test_predictions.csv- The
.csvfile is a structured dataframe with final predictions for the provided test dataframe.
- The
-
test_raw_predictions.pkl- The
.pklfile is a pickled Python dictionary with raw predictions for the provided test dataframe.
- The
Note
The above predictions are in the View predictions card. These predictions on the View predictions card are generated when using completed experiments to score on new dataframes. To learn how to score on new data using completed experiments, see H2O Hydrogen Torch UI.
-
The structure of the files in the .zip file are different among all supported problem types. Below, you can find details about the file formats depending on the problem type.
Image Regression
For image regression, the validation and test .csv and .pkl files have the same format:
-
predictions
A 2-dimensional NumPy array that contains label predictions. The shape of the array is (n, m), where n represents the number of observations, while m represents the number of labels.
-
labels
A 1-dimensional NumPy array that contains label names.
-
{image_column}
A 1-dimensional NumPy array that contains input image names. The name of the key is
{image_column}whereimage_columnrefers to the name of the image column in the train dataframe.Note
You can define the
{image_column}under the Dataset settings section when building an image regression experiment.
-
All the N columns in the train dataframe.
-
A column name
pred_{label_column_name}that contains probabilities for the label column,label_column_namerefers to the label column name found in the train dataframe.Note
-
For multi-label image regression experiments, more than one
pred_{label_column_name}column is in the.csvreferring to the predicted probability for each of the label columns from the train dataframe. -
You can define the
label_column_name(s) under the Dataset settings section when building an image regression experiment.
-
Note
-
The i-th sample of each output's dictionary item matches the i-th row of the dataframe.
-
To learn how to open the
.csvand.pklfiles, see Open.csvand.pklFiles with Python.
Image Classification
For image classification, the validation and test .csv and .pkl files have the same format:
-
predictions
A 2-dimensional NumPy array that contains class probabilities. The shape of the array is (n, m), where n represents the number of observations, while m represents the number of classes.
-
labels
A 1-dimensional NumPy array that contains label names.
-
{image_column}
A 1-dimensional NumPy array that contains input image names. The name of the key is
{image_column}whereimage_columnrefers to the name of the image column in the train dataframe.Note
You can define the
{image_column}under the Dataset settings section when building an image classification experiment.
-
All the N columns in the train dataframe.
-
A column name
pred_{label_column_name}that contains probabilities for the label column,label_column_namerefers to the label column name found in the train dataframe.Note
-
For multi-label and multi-class image classification experiments, more than one
pred_{label_column_name}column is be in the.csvreferring to the predicted probability for each of the label columns from the train dataframe. -
You can define the
label_column_name(s) under the Dataset settings section when building an image classification experiment.
-
Note
-
The i-th sample of each output's dictionary item matches the i-th row of the dataframe.
-
To learn how to open the
.csvand.pklfiles, see Open.csvand.pklFiles with Python.
Image Metric Learning
For image metric learning, the validation and test .csv and .pkl files have the same format:
-
embeddings
A 2-dimensional NumPy array that contains image embeddings. The shape of the array is (n, m), where n represents the number of observations, while m represents the
{embedding_size}where{embedding_size}refers to the selected embedding size value used during the experiment. Images with nearby embedding vectors are predicted to have similar content.Note
You can define the
{embedding_size}under the Architecture settings section when building an image metric learning experiment. -
cosine_similarities
A 2-dimensional NumPy array that contains cosine similarities between validation/test images. The shape of the array is as follows:
number_of_observationsx{top_k_similar}where{top_k_similar}refers to the selectedTop K Similarvalue used during the experiment. -
similar_images
A 2-dimensional NumPy array that contains indices of similar validation/test images. The shape of the array is as follows:
number_of_observationsx{top_k_similar}where{top_k_similar}refers to the selectedTop K Similarvalue used during the experiment. -
{image_column}
A 1-dimensional NumPy array that contains input image names. The name of the key is
{image_column}whereimage_columnrefers to the name of the image column in the train dataframe.Note
You can define the
{image_column}under the Dataset settings section when building an image metric learning experiment.
-
All the N columns found in the train dataframe.
-
Three columns name
top_{k}_similar_image, where k can represent a number between 1 to 3, which contains the top k name of an image similar to the input image. -
Three columns name
top_{k}_cosine_similarity, where k can represent a number between 1 to 3, which contains the cosine similarity value between the input image and thetop_{k}_similar_image.
Note
-
The i-th sample of each output's dictionary item matches the i-th row of the dataframe.
-
To learn how to open the
.csvand.pklfiles, see Open.csvand.pklFiles with Python.
Image Object Detection
For image object detection, the validation and test .csv and .pkl files have the same format:
-
boxes
A 3-dimensional NumPy array that contains predicted bounding boxes. The shape of the array is as follows:
number_of_observationsxnumber_of_bounding_boxesx 4.Note
number_of_bounding_boxesis limited to 100 most confident boxes, all in the format of: (x_min,y_min,x_max,y_max). -
confidences
A 2-dimensional NumPy array that contains bounding boxes confidences (from 0 to 1). The shape of the array is (n, m), where n represents the number of observations, while m represents the number of bounding boxes.
-
classes
A 2-dimensional NumPy array that contains class names of bounding boxes. The shape of the array is (n, m), where n represents the number of observations while m represents the number of bounding boxes.
-
{image_column}
A 1-dimensional NumPy array that contains input image names. The name of the key is
{image_column}whereimage_columnrefers to the name of the image column in the train dataframe.Note
You can define the
{image_column}under the Dataset settings section when building an image object detection experiment.
-
A column name
{image_column_name}whereimage_column_namerefers to the image column name in the train dataframe.Note
You can define the
image_column_nameunder the Dataset settings section when building an image object detection experiment. -
A column name
x_minthat contains the minimum x coordinates for the bounding boxes. -
A column name
y_minthat contains the minimum y coordinates for the bounding boxes. -
A column name
x_maxthat contains the maximum x coordinates for the bounding boxes. -
A column name
y_maxthat contains the maximum y coordinates for the bounding boxes. -
A column name
confidencethat contains the confidence scores of all the corresponding bounding boxes, only bounding boxes with a confidence score larger than theprobability_thresholdare considered.Note
You can define the
{probability_threshold}under the Validation settings section when building an image object detection experiment. -
A column name
{class_name_column}that contains the class names of all the corresponding bounding boxes, whereclass_name_columnrefers to the name of a column in the train dataframe referring to the class names.
Note
To learn how to open the .csv and .pkl files, see Open .csv and .pkl Files with Python.
Image Semantic Segmentation
For image semantic segmentation, the validation and test .csv and .pkl files, for the most part, have similar formats; differences are noted below:
-
masks
A 4-dimensional NumPy array that contains pixel-wise probabilities. The shape of the array is as follows:
number_of_observationsxnumber_of_classesx{image_height}x{image_width}.Note
You can define the
{image_height}and{image_width}under the Image settings section when building an image semantic segmentation experiment. -
original_image_shapes
A 2-dimensional NumPy array that contains shapes of the original input images. The shape of the array is as follows:
number_of_observationsx2, where the 2nd dimension containsoriginal_image_heightandoriginal_image_widthof the corresponding input image. -
rle_predictions
A 2-dimensional NumPy array that contains RLE-encoded predictions for each class. The shape of the array is as follows:
number_of_observationsxnumber_of_classes. You can use RLE predictions with corresponding original_image_shapes to decode RLE-encoded strings to binary masks. -
class_names
The
class_namesrefers to a list containing all the class names. The class names follow the order of the class names in the 4-dimensional NumPy masks array. -
{image_column}
A 1-dimensional NumPy array that contains input image names. The name of the key is
{image_column}whereimage_columnrefers to the name of the image column in the train dataframe.Note
You can define the
{image_column}under the Dataset settings section when building an image semantic segmentation experiment.
-
All the N columns in the train dataframe.
Note
The
.csvfile repeats X times each original row in the train dataframe while having each row contain a different run-length-encoded mask prediction for a given class, where X refers to the{number_of_classes}.
In the case that the train dataframe contains a {class_name_column} and {rle_mask_column}:
-
A column name
{class_name_column}that contains input class names, whereclass_name_columnrefers to the name of the column in the train dataframe that refers to the class names. -
A column name
{rle_mask_column}that contains all the true Run-length encodings (RLEs) in the train dataframe.Note
You can define the
{class_name_column}and{rle_mask_column}under the Dataset settings section when building an image semantic segmentation experiment.
In the case that the test dataframe does not contain a {class_name_column} or {rle_mask_column} or both:
-
The first column in the
.csvfile has the nameclass_id, and no column with true Run-length encodings (RLEs). -
A column with a prefix
pred_follow by a suffix{rle_mask_column}that contains the predicted Run-length encodings (RLEs) of all the predictions, whererle_mask_columnrefers to the name of the Run-length encodings mask column in the train dataframe.Note
-
If there's not a
{rle_mask_column}in the train dataframe, this column is namepred_mask. -
If no mask is predicted, then the column value is an empty string.
-
You can define the
{rle_mask_column}under the Dataset settings section when building an image semantic segmentation experiment.
-
Note
-
The i-th sample of each output's dictionary item matches the i-th row of the dataframe.
-
To learn how to open the
.csvand.pklfiles, see Open.csvand.pklFiles with Python.
Image Instance Segmentation
For image instance segmentation, the validation and test .csv and .pkl files, for the most part, have similar formats; differences are noted below:
-
raw_probabilities
A 4-dimensional NumPy array that contains pixel-wise probabilities. The shape of the array is as follows:
number_of_observationsxnumber_of_classes + 2x{image_height}x{image_width}. Two additional channels (+ 2) are added to thenumber_of_classescorresponding to individual instance borders and borders between instances.Note
You can define the
{image_height}and{image_width}under the Image settings section when building an image instance segmentation experiment. -
instance_predictions
A 4-dimensional NumPy array containing instance predictions, where each instance is represented as a separate integer number starting from 1 for each class. The shape of the array is as follows:
number_of_observationsxoriginal_image_heightxoriginal_image_widthxnumber_of_classes, whereoriginal_image_heightandoriginal_image_widthare height and width of the corresponding input image. -
confidences
A list of dictionaries containing prediction confidences for each instance; the length of the list is N (
number_of_observations). Each element of the list is a dictionary with keys representing the class names and values representing the confidences for each instance ID (starting from 1). -
class_names
The
class_namesrefer to a list containing all the class names. The class names follow the order of the class names in the 4-dimensional Numpy raw_probabilities array and the 4-dimensional NumPy instance_predictions array. -
{image_column}
A 1-dimensional NumPy array that contains input image names. The name of the key is
{image_column}whereimage_columnrefers to the name of the image column in the train dataframe.Note
You can define the
{image_column}under the Dataset settings section when building an image semantic segmentation experiment.
-
A column name
{image_column_name}whereimage_column_namerefers to the image column name in the train dataframe.Note
You can define the
image_column_nameunder the Dataset settings section when building an image instance segmentation experiment. -
A column name
{class_name_column}that contains the class names for each instance predicted, whereclass_name_columnrefers to the name of the column in the train dataframe that refers to the class names. -
A column name
instance_rlethat contains Run-length encoded (RLEs) mask for each instance. -
A column name
confidencethat contains the confidence scores for each instance.
Note
- To learn how to open the
.csvand.pklfiles, see Open.csvand.pklFiles with Python.
Text Regression
For text regression, the validation and test .csv and .pkl files have the same format:
-
predictions
A 2-dimensional NumPy array that contains label predictions. The shape of the array is (n, m), where n represents the number of observations, while m represents the number of labels.
-
labels
A 1-dimensional NumPy array that contains label names.
-
{text_column}
A 1-dimensional NumPy array that contains input texts. The name of the key is
{text_column}wheretext_columnrefers to the name of the text column in the train dataframe.Note
You can define the
{text_column}under the Dataset settings section when building an text regression experiment.
-
All the N columns in the train dataframe.
-
A column name
pred_{label_column_name}that contains probabilities for the label column,label_column_namerefers to the label column name found in the train dataframe.Note
-
For multi-label text regression experiments, more than one
pred_{label_column_name}column is in the.csv, referring to the predicted probability for each of the label columns from the train dataframe. -
You can define the
label_column_name(s) under the Dataset settings section when building an text regression experiment.
-
Note
-
The i-th sample of each output's dictionary item matches the i-th row of the dataframe.
-
To learn how to open the
.csvand.pklfiles, see Open.csvand.pklFiles with Python.
Text Classification
For text classification, the validation and test .csv and .pkl files have the same format:
-
predictions
A 2-dimensional NumPy array that contains class probabilities. The shape of the array is (n, m), where n represents the number of observations, while m represents the number of classes.
-
labels
A 1-dimensional NumPy array that contains label names.
-
{text_column}
A 1-dimensional NumPy array that contains input texts. The name of the key is
{text_column}wheretext_columnrefers to the name of the text column in the train dataframe.Note
You can define the
{text_column}under the Dataset settings section when building a text classification experiment.
-
All the N columns in the train dataframe.
-
A column name
pred_{label_column_name}that contains probabilities for the label column,label_column_namerefers to the label column name found in the train dataframe.Note
-
For multi-label and multi-class text classification experiments, more than one
pred_{label_column_name}column is in the.csvreferring to the predicted probability for each of the label columns from the train dataframe. -
You can define the
label_column_name(s) under the Dataset settings section when building a text classification experiment.
-
Note
-
The i-th sample of each output's dictionary item matches the i-th row of the dataframe.
-
To learn how to open the
.csvand.pklfiles, see Open.csvand.pklFiles with Python.
Text Sequence to Sequence
For text sequence to sequence, the validation and test .csv and .pkl files have the same format:
-
{text_column}
A 1-dimensional NumPy array that contains the input text observed. The name of the key is
{text_column}wheretext_columnrefers to the name of the text column in the train dataframe.Note
You can define the
{text_column}under the Dataset settings section when building a text sequence to sequence experiment. -
predicted_text
A 1-dimensional NumPy array that contains predictions in a string format for the input text column in the train dataframe.
-
All the N columns found in the train dataframe.
-
A column with a prefix
pred_followed by{name_of_the_output_text}that contains predictions for the output text ({label_columns}).Note
You can define the
{label_columns}under the Dataset settings section when building a text sequence to sequence experiment.
Note
-
The i-th sample of each output's dictionary item matches the i-th row of the dataframe.
-
To learn how to open the
.csvand.pklfiles, see Open.csvand.pklFiles with Python.
Text Span Predictions
For text span predictions, the validation and test .csv and .pkl files have the same format:
-
{question_column}
A 1-dimensional NumPy array that contains the input question text. The name of the key is
{question_column}wherequestion_columnrefers to the name of the question text column in the train dataframe.Note
You can define the
{question_column}under the Dataset settings section when building a Text Span Predictions experiment. -
{context_column}
A 1-dimensional NumPy array that contains the input context text. The name of the key is
{context_column}wherecontext_columnrefers to the name of the context text column in the train dataframe.Note
You can define the
{context_column}under the Dataset settings section when building a text span predictions experiment. -
predictions
A 1-dimensional NumPy array that contains predictions in a string format for every input question. The predicted string is a substring of the corresponding context text.
-
predicted_{answer_column_name}_top_k
A 1-dimensional NumPy array that contains top-K predictions (in a string form) for the answer column, where k represents the number of predictions the model generated for the answer column.
-
All the N columns found in the train dataframe.
-
A column name
pred_{answer_column_name}that contains predictions (in a string form) for the answer column, where theanswer_column_namerefers to the name of the answer column found in the train dataframe. -
A set of N columns, with the following name convention:
pred_{answer_column_name}_top_{k}.-
N refers to the number of answers the model generated for the answer column
Note
The number of answers the model generates is determined by the number specified in the following dataset setting: Number of predicted answers.
-
answer_column_namerefers to the name of the answer column found in the train dataframe -
krefers to the rank of the prediction for the answer column, where k can represent a number between 1 to N, where N refers to the specified number of predictions to generate. Generated predictions are ranked from highest to lowest, where 1 refers to the highest prediction.Note
You can specify the number of predictions for the answer column using the following dataset setting: Number of predicted answers.
-
Note
-
The i-th sample of each output's dictionary item matches the i-th row of the dataframe.
-
To learn how to open the
.csvand.pklfiles, see Open.csvand.pklFiles with Python.
Text Token Classification
For text token classification, the validation and test .csv and .pkl files have the same format:
-
probabilities
A list of 2-dimensional NumPy arrays that contains word-level probabilities for each token, where the length of the list is N (
number_of_observations). The shape of each array in the list is as follows:text_lengthxnumber_of_classes, wheretext_lengthis the number of words in the input text. -
predictions
A 1-dimensional NumPy array that contains predictions in the form of a list of predicted classes for each input word found in the input text.
-
labels
A 1-dimensional NumPy array that contains label names.
-
{text_column}
A 1-dimensional NumPy array that contains input texts. The name of the key is
{text_column}wheretext_columnrefers to the name of the text column in the train dataframe.
-
All the N columns found in the train dataframe.
-
A column name
pred_{label_column_name}that contains predictions for the{label_column_name}column in a form of a string space-separated by predicted classes for each input word.Note
- You can define the
label_column_nameunder the Dataset settings section when building a text token classification experiment.
- You can define the
Note
-
The i-th sample of each output's dictionary item matches the i-th row of the dataframe.
-
To learn how to open the
.csvand.pklfiles, see Open.csvand.pklFiles with Python.
Text Metric Learning
For text metric learning, the validation and test .csv and .pkl files have the same format:
-
embeddings
A 2-dimensional NumPy array that contains text embeddings. The shape of the array is (n, m), where n represents the number of observations, while m represents the embedding size. Texts with similar embeddings are predicted to have a similar semantic meaning.
Note
You can define the
{embedding_size}under the Architecture settings section when building a text metric learning experiment. -
cosine_similarities
A 2-dimensional NumPy array that contains cosine similarities between validation (test) texts. The shape of the array is as follows:
number_of_observationsx{top_k_similar}where{top_k_similar}refers to the selectedTop K Similarvalue used during the experiment. -
similar_texts
A 2-dimensional NumPy array that contains indices of similar validation (test) texts. The shape of the array is as follows:
number_of_observationsx{top_k_similar}where{top_k_similar}refers to the selectedTop K Similarvalue used during the experiment. -
{text_column}
A 1-dimensional NumPy array that contains texts from the original text column in the train dataframe. The name of the key is
{text_column}wheretext_columnrefers to the name of the text column in the train dataframe.Note
You can define the
{text_column}under the Dataset settings section when building a text metric learning experiment.
-
All the N columns found in the train dataframe.
-
Three columns name
top_{k}_similar_text, where k can represent a number between 1 to 3, which contains the top k text similar to the input text. -
Three columns name
top_{k}_cosine_similarity, where k can represent a number between 1 to 3, which contains the cosine similarity value between the input text and thetop_{k}_similar_text.
Note
-
The i-th sample of each output's dictionary item matches the i-th row of the dataframe.
-
To learn how to open the
.csvand.pklfiles, see Open.csvand.pklFiles with Python.
Audio regression
For audio regression, the validation and test .csv and .pkl files have the same format:
-
predictions
A 2-dimensional NumPy array that contains label predictions. The shape of the array is (n, m), where n represents the number of observations, while m represents the number of labels.
-
labels
A 1-dimensional NumPy array that contains label names.
-
{audio_column}
A 1-dimensional NumPy array that contains input audio names. The name of the key is
{audio_column}whereaudio_columnrefers to the name of the audio column in the train dataframe.Note
You can define the
{audio_column}under the Dataset settings section when building an audio regression experiment.
-
All the N columns in the train dataframe.
-
A column name
pred_{label_column_name}that contains probabilities for the label column,label_column_namerefers to the label column name found in the train dataframe.
Note
-
The i-th sample of each output's dictionary item matches the i-th row of the dataframe.
-
To learn how to open the
.csvand.pklfiles, see Open.csvand.pklfiles with Python.
Audio classification
For audio classification, the validation and test .csv and .pkl files have the same format:
-
predictions
A 2-dimensional NumPy array that contains class probabilities. The shape of the array is (n, m), where n represents the number of observations, while m represents the number of classes.
-
labels
A 1-dimensional NumPy array that contains label names.
-
{audio_column}
A 1-dimensional NumPy array that contains input audio names. The name of the key is
{audio_column}whereaudio_columnrefers to the name of the audio column in the train dataframe.Note
You can define the
{audio_column}under the Dataset settings section when building an audio classification experiment.
-
All the N columns in the train dataframe.
-
A column name
pred_{label_column_name}that contains probabilities for the label column,label_column_namerefers to the label column name found in the train dataframe.Note
-
For multi-label and multi-class audio classification experiments, more than one
pred_{label_column_name}column is in the.csvreferring to the predicted probability for each of the label columns from the train dataframe. -
You can define the
label_column_name(s) under the Dataset settings section when building an audio classification experiment.
-
Note
-
The i-th sample of each output's dictionary item matches the i-th row of the dataframe.
-
To learn how to open the
.csvand.pklfiles, see Open.csvand.pklFiles with Python.
Open .csv and .pkl files with Python
Using Python, a .csv or .pkl file can be open as follows:
import pickle
import pandas as pd
df = pd.read_csv('text_classification/validation_predictions.csv')
with open('text_classification/validation_raw_predictions.pkl', 'rb') as f:
    out = pickle.load(f)
out.keys()
dict_keys(['predictions', 'comment_text', 'labels'])
df.head(1)
| id | comment_text | label_toxic | label_severe_toxic | label_obscene | label_threat | label_insult | label_identity_hate | fold | pred_label_toxic | pred_label_severe_toxic | pred_label_obscene | pred_label_threat | pred_label_insult | pred_label_identity_hate |
|---|---|---|---|---|---|---|---|---|---|---|---|---|---|---|
| 000103f0d9cfb60f | D'aww! He matches this background colour I'm s... | 0 | 0 | 0 | 0 | 0 | 0 | 0 | 0.00041 | 0.000168 | 0.000328 | 0.000142 | 0.000247 | 0.000155 |
- Submit and view feedback for this page
- Send feedback about H2O Hydrogen Torch to cloud-feedback@h2o.ai